Single Cell Voltage
The Single Cell Voltage chart display the actual voltage of each of the 4 cells that makes the internal stack of batteries, and the cell temperature on a time scale.
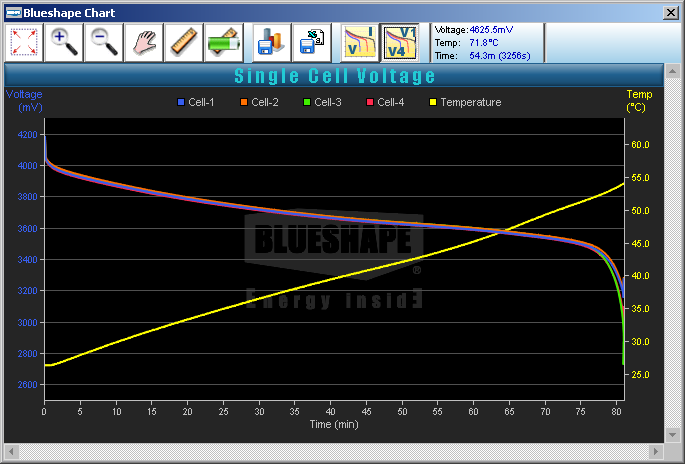
The chart is autoscaled to show all the possible information in one windows, scaling automatically from seconds to minutes as logged data increases.
The Voltage of each single cell is displayed on a different data series painted using different color (blue, orange, green, red) to better distinguish one series from the others. The scale on the left hand side of the chart is set automatically from 2600mV to 4200mV.
The Temperature series shows the Cell Temperature: it is displayed in yellow and uses the scale on the right hand side of the chart, that is changed automatically depending on the data shown.
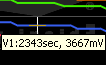
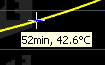
Chart hot spot:
|
When the mouse moves over a "hotspot" (a chart element that holds relevant informations, typically a data series), the pointer changes automatically to a white cross and if the mouse stops over it for a while, the coordinates of that data point underneath the mouse pops-up. |
Other tools are available to get additional information, analyse data and manipulate the chart.