Voltage and Current
The Voltage and Current chart displays the actual battery voltage and actual charge or discharge currents (with the cell temperature) on a time scale.
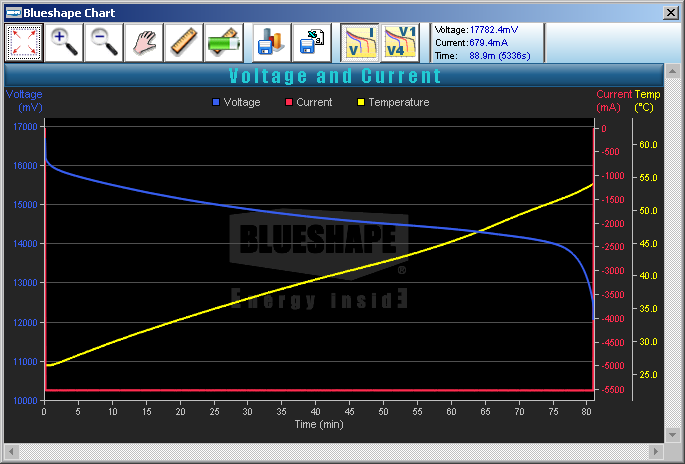
The chart is autoscaled to show all the possible information in one window, scaling automatically from seconds to minutes as logged data accumulates.
The Voltage series shows the Battery Voltage: it is displayed in blue and uses the scale on the left hand side of the chart, that is set automatically from 10000mV to 17000mV.
The Current series shows the Actual Current: it is displayed in red and uses the scale on the right hand side of the chart, that is changed automatically depending on the variety in the data shown. Positive values (charging currents) are plotted above the zero; negative values (discharging currents) below
The Temperature series shows the Cell Temperature: it is displayed in yellow and uses the rightmost scale, that is also changed automatically depending on the data shown.
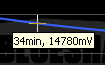
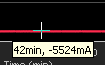
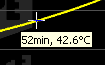
Chart hot spot:
|
When the mouse moves over a "hotspot" (a chart element that holds relevant information, typically a data series), the pointer changes automatically to a white cross and if the mouse stops over it for a while, the coordinates of that data-point underneath the mouse pops-up. |
Other tools are available to get additional information, analyse data and manipulate the chart.